Trading Systems 101-Part2: Types of Trading Systems and key evaluation metrics
Different styles and different metrics
Types of Trading Systems
Algorithmic systems can be classified according to the way they operate or the particularities of their strategy in terms of the way they operate or the particularities of their signal generation strategy.
- Trend systems.
They seek to exploit a trend in the time interval of choice. Until they find the trend they make several attempts, so they usually have a rather low percentage of success, in the quite low, in the surroundings of 40%, nevertheless when they hit they win much more than they lose (commonly the triple or 3:1 ratio).
They are hard to trade but bring great joy to the portfolio.
Systems to make money, not to be right.
- Anti-trend systems.
They operate against the trend, so that they buy when the market has fallen and open short positions after rises. They are quite successful, but at the cost of a very low ratio between winning and losing trades. A typical success rate of an antitrend system would be between 60 and 80%.
A typical success rate of an antitrend system would be between 60 and 80%.
This makes them easy to buy and they are a favorite of many traders.
- Breakout systems.
BreakoutSystems buy when the market rises above a certain level. These systems are not very accurate but they never miss a trend because of the way they operate. They are an alternative to trend systems with the advantage that they guarantee the entry in any prolonged trend.
One of the most famous systems that employ this type of operation is the Turtle System, based on applying this technique to multiple markets.
Try it, some say it doesn't work anymore... those who haven't tried it.
In some publications these systems can be found within the trend category, however they are usually separated by the type of entry.
- Volatility systems
They are based on the intraday overcoming of a certain level that assures as far as possible that a trend has just started. These systems operate a lot but are generally very profitable. They have a percentage of success that can be between 50-60%.
- Systems based on Seasonals and Cycles.
They exploit the existence of cycles, so that the operation is generated based on certain dates. Here we have the seasonal systems that operate on the harvests or based on the publication of periodic data or psychological behavior for example. There are also systems based on lunar cycles and even planetary cycles.
Do you think the price of gasoline or wheat can be influenced by circumstances at certain times of the year?
If it's easy, why aren't you trading it?
- Prediction Systems.
They use the most advanced techniques to anticipate price evolution. A good example are systems based on neural networks that learn and are trained with historical data until they achieve the most reliable prediction possible of the next market evolution. There are also mathematical prediction techniques with regression models that, without using neural networks, make predictions that are adjusted to minimize error.
There is no evidence that the higher the level of complexity, the higher the level of benefits.
However, I do find evidence that using complex terms that include AI, deep learning and the like work great as marketing techniques.
Complexity does not add benefits, it adds complexity
We could talk about more types of systems with types and subtypes but broadly speaking this is a good summary. The ideal is to have several of each and thus form a portfolio.
Key Ratios for Evaluating System Performance
Sharpe Ratio:
Measures the excess return (or risk-adjusted return) per unit of standard deviation in the system's returns. It helps understand the trade-off between expected return and risk, indicating how much additional return an investor receives for taking on extra volatility.
Sortino Ratio:
Similar to the Sharpe Ratio but considers only the standard deviation of negative returns, focusing on downside risk. It's useful for investors who are more concerned about potential losses than the overall volatility.
Calmar Ratio:
Compares the annualized return of a system with its maximum drawdown, providing a measure of the investment’s return relative to its risk of loss. A higher Calmar Ratio indicates a better performance per unit of risk.
Maximum Drawdown (Max Drawdown):
Indicates the maximum loss from peak to trough before a new peak is attained, showing the potential risk of loss in an investment. It's critical for understanding the most significant drop in value a system has experienced.
Win/Loss Ratio:
Compares the average size of winning trades to the average size of losing trades. This ratio helps determine the system's effectiveness and efficiency in managing trades.
Winning Percentage:
Reflects the proportion of trades that are profitable, relative to the total number of trades. A high winning percentage indicates a system frequently generates gains.
Profit Factor:
The ratio of total gains to total losses. A profit factor greater than 1 suggests that the system is profitable, with larger values indicating higher profitability.
Beta:
Measures the volatility or systemic risk of a system in comparison to the market as a whole. A beta greater than 1 indicates higher volatility than the market, while a beta less than 1 indicates lower volatility.
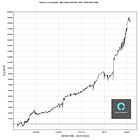
The metric that provides the most information at a glance is an equity curve, as long as you have a trained eye.
Every Saturday I publish a trading system, every week its price goes up $10 and when the month changes you will no longer be able to get them.
Subscribe now and lock your price:
Do you need tradsing systems? Shoot
….


